


On April 27, Interface (IFSIA) reported First Quarter 2011 earnings. Highlights…
- Revenues rose 13% to $245.4MM
- Operating Income was 7.8% of sales (up 27.4%)
- Net income was $9.8MM vs. $4.9MM.
- The above translates to EPS of $0.15 vs. $0.08
- EPS met analysts’ consensus estimates.
- Note: all of the above exclude charges. 1Q is the company’s slowest quarter.
- link to 1Q’11 Press Release
 |
| Click the image above for clearer wording. Source: Interface. |
What’s Changed vs. our Initial View: Based on what I’m hearing from the street and economics departments, the carpet industry will continue to be weak at best. New Construction will remain lackluster, so the company’s growth will depend on increasing market share in the office market and getting the word out to consumers (as it tries to compete in the retail market). Based on earnings data and conference call comments, we believe both Operating and Free Cash Flow will be somewhat lower than initially forecast (see below for additional information.)
What we liked in the 1Q’11 report:
Interface has been able to increase profitability despite rising raw material costs and the weak construction market. Plants are running smoothly.
IFSIA remains committed to sustainability with recycled fiber reaching a high of 40%. Though, Interface will not stop there, as its long-term goal is 80%. An interesting remark on the call was that few consumers were interested in buying green carpets, and that Interface’s ESG won’t be in the headline marketing for the retail business. This demonstrates management’s authenticity in my view.
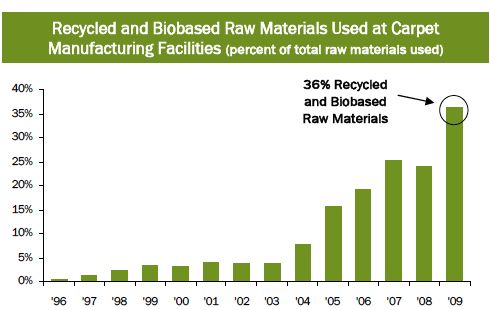 |
| Interface: Historical data on Recycled Materials |
What we didn’t like:
As mentioned earlier, company is spending heavily on promoting its carpets (new direct retail channel), and increasing manufacturing production. This is pressuring Free Cash Flow, indirectly via higher SG&A, higher Capex, and working capital.
What’s Interface worth?
Interface’s shares appear fully-valued using Price-to-Earnings data, and earnings estimates. I believe a corporation’s P/E ratio primarily reflects earnings growth, of which is then adjusted for industry structure and the firm’s leadership position. As such, the current P/E of 21x appears to fully reflect earnings growth for 2012. This number is lower than the 27x when we first wrote about IFSIA; however growth is expected to slow in 2013 (unless economic growth picks-up).
Earnings & Cash Flow Quality:
Perhaps it’s appropriate to add a few comments given that this website’s “raised Hell” about the earnings quality of Green Mountain Coffee Roasters–>STORY.
Compared to the same quarter last year, both earnings and quality of cash flow was High. Interface continued to incur start-up costs at its plant in China. It could have separated these in its earnings presentation to make earnings appear better. Though, management chose not to. Last year the company had bond retirement and restructuring charges that were presented separately from GAAP earnings. This quarter’s earnings release was “cleaner” as it only presented GAAP earnings. Operating Cash Flow was depressed from higher inventories (see comments below) and a speedier payoff of short-term bills/payables. Hence, we also rate Cash Flow quality as HIGH.
 |
| Click the image for clearer wording. Source: Interface. |
1Q’11 Earnings Highlights:
- Revenues rose 13% and business is tracking well. Though the first month of the quarter started weak because of bad weather both in US and Europe. 2Q’11 is off to a good start.
- Geographically: Growth witnessed in all regions. Though some parts of Asia growing slowly, however, Australia is doing well. Europe is doing ok, with strength in Italy (small market) and Germany. Biggest opportunity is Germany which has the lowest modular carpet penetration and the biggest volumes. However, overall European business is too low, keeping capacity use at just 60%. This hinders profitability. Management specifically stated that it needed the UK to kick in.
- Orders grew 10% Y/Y. This is okay, but lower than previous quarters. Though, momentum rose as quarter progressed. (In fact, an analyst from Raymond James Financial was concerned over the Book/Bill ratio on the conference call.)
- Profitability: Interface is able to maintain and increase profit margins. So, far it’s been able to pass along price increases. There will be another increase in May. SG&A expenses, which increased as we expected, are now forecast to decline in the coming quarters both on a % of sales basis, and in dollar terms. (Though, we acknowledge this seems inconsistent with the company’s plan to increase market share.)
- Direct-Channel: Retail stores are doing better than expected. Chicago’s same-store-sales rose 50%, and the new store in SOHO, New York City had a successful March opening. Note that this is a new business area, and S/S sales data may not represent true secular growth.
- Operating Cash Flow for the quarter was weak (an $18MM deficit) due to high working capital usage. Interface spent 38% more on inventories Y/Y as it was worried that it would repeat the under-investment of 2010. It also over-ordered some raw materials before expected price increases.
- China plant (and costs thereof) continue as planned. No surprises. I’ve seen photos of the plant; it appears modern and well designed, and will include both a showroom, and open views of the factory floor (which is also great for transparency). See image below, courtesy of Interface Inc.
- Will add 50 salespeople to boost share in non-traditional end markets.

Disclosures: The author is long IFSIA. Information for the above report based on industry data, the company’s press release, Investor Presentation 2010, conference calls, and data provided by sell-side equity analysts.