Helios and Matheson: I’ve seen this movie before, and it ends badly !


(LAM) Lombardo Asset Management
Socially Responsible Investing

I first noticed CHC Group (NYSE: HELI) in 2014 when I was examining the Energy Industry. As a former industry analyst I thought that its business of flying workers back & forth to offshore oil rigs was highly sensitive to oil prices, despite being classified as a transportation company. HELI has the world’s largest helicopter fleet (231) serving several geographic locations, of which over 81% of FY’15 (ended 4/15) revenues are to the energy end-market (i.e, E&P companies).
 |
| Source: CHC Group |
What caught my eye was the company’s sloppy-looking financials and its huge 10k report. While the left-brain side is important for company analysis, it is the right-brain that makes investing more of an art than science!
The chart below shows the yearly change in SPDR Oil Service ETF (XES) versus CHC Group (HELI). Clearly they are correlated. Further, CHC Group performed much worse than its peer group since Jan’15 due to its high financial leverage.
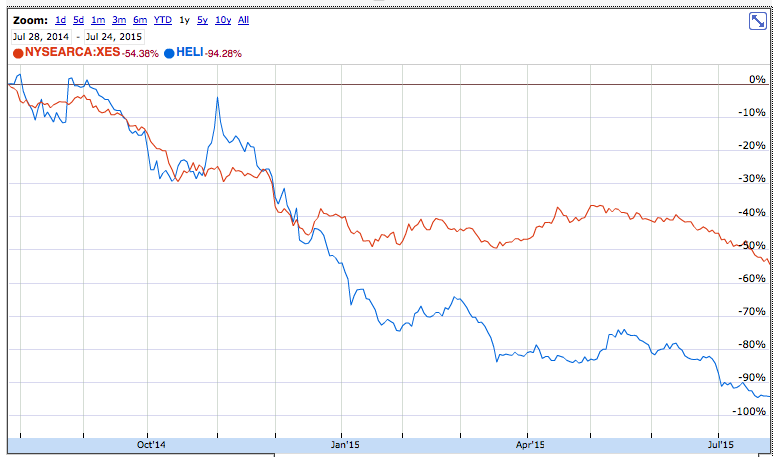 |
| Courtesy of GoogleFinance |
After seeing CHC Group’s recent stock price trading under $1.00, I thought why bother writing about this. It’s too late! But then I remembered all the soured investments in penny-stocks I had made as a novice trader. At that time, I thought these volatile issues just needed to go up 50 cents and I’d sell. However, investing in low-priced stocks is a fast-lane to the Poor-House.
This article is for all my fellow investors that have no access to brokerage-reports, not even Seeking Alpha has written much on HELI. So then, maybe this is my social responsibility to investors!
We all know that commodity prices are weak and oil is now trading below $50/barrel. I’m a big believer of Contrarian Investing. However folks – playing a risky small company is not the way to do it – Exchange Traded Funds are.
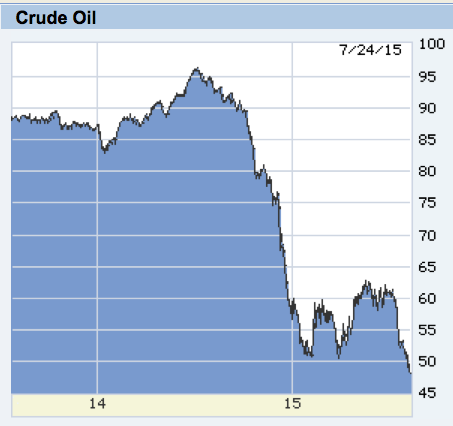 |
| Source: WSJ Market Data Center |
Business Outlook:
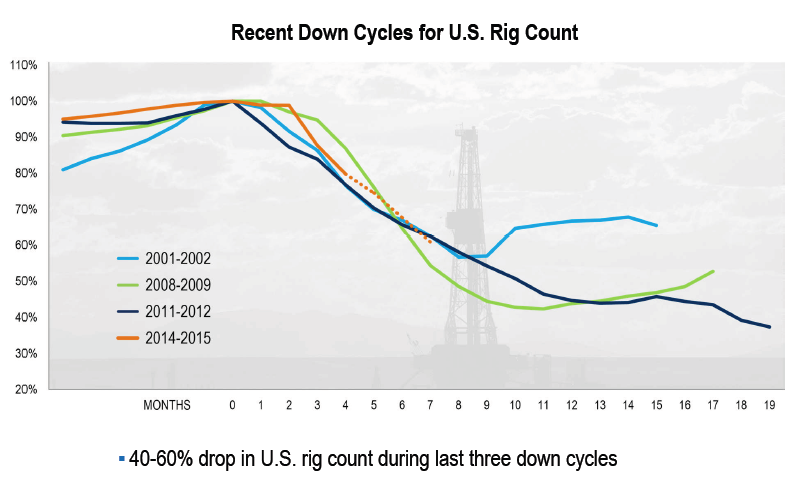
CHC Group’s business is closely tied to worldwide E&P budgets, of which is correlated with oil prices and the number of drilling rigs. While CHC’s business is most closely tied to offshore global drilling, the chart below (from Baker Hughes) is quite useful as it shows the number of months before the industry actually hits bottom.
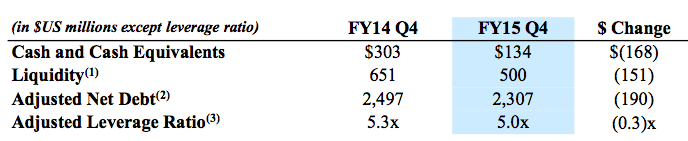
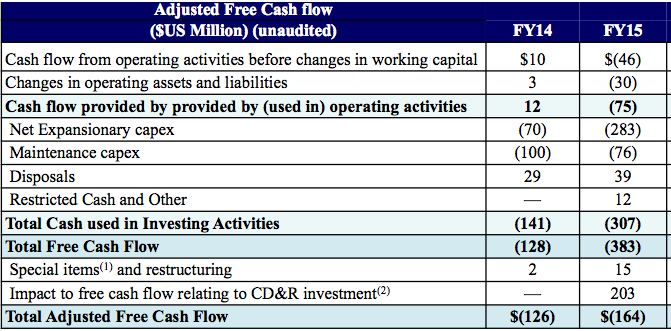
Below I will briefly list the main reasons why investors should avoid CHC Group. Essentially, this is a small company bleeding cash that has a highly leveraged balance sheet. If existing trends continue, the company will likely go into bankruptcy proceedings, or undergo a debt-recapitalization in which a private equity company such as Clayton, Dublier & Rice (CDR) takes over the company. Should this happen, equity holdes will be wiped-out.
Reporting Issues:
Balance Sheet:
Management & Governance:
So what’s CHC Group worth?
Given that the firm does not pay dividends, hasn’t made money, and has negative equity, an investor or potential buyer cannot value the company using conventional benchmarks such as P/E ratio, Price-book ratio, or dividend discount model. A discounted FCF model may be used but the company doesn’t have positive cash flow so that would be based entirely on assumptions.
So we come down to Enterprise Value (EV). Even here, one cannot simply use reported debt of $1.2bn as there is another $1.2bn or so of OBS debt. After including the above, adding preferred stock and netting against cash, CHC’s Enterprise Value is $3bn. Buyers typically pay a multiple of EV, however, in this case a potential buyer would likely wait for a distressed situation, then pay a low multiple given that the debt would be trading at a low market value.
Conclusion:
While the average investor may not appreciate every detail of this article, my goal was to protect you from making a hasty decision. There are many investments as well as turnaround situations that have much lower risk and higher returns.
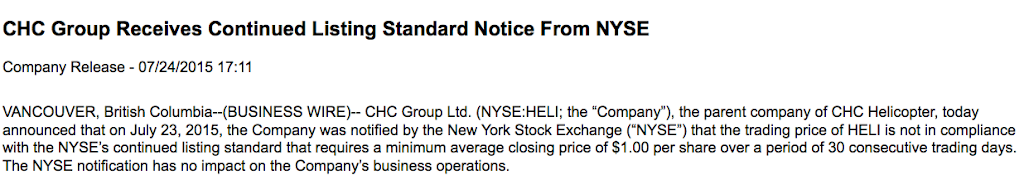
Penny stocks are for the birds. On 7/23/15, the NYSE notified CHC Group that they have 6 months to bring their shares over $1.00 else face a delisting.
Disclosure: The author has no position in CHC Group (HELI) and has not received any direct or indirect compensation for this article.
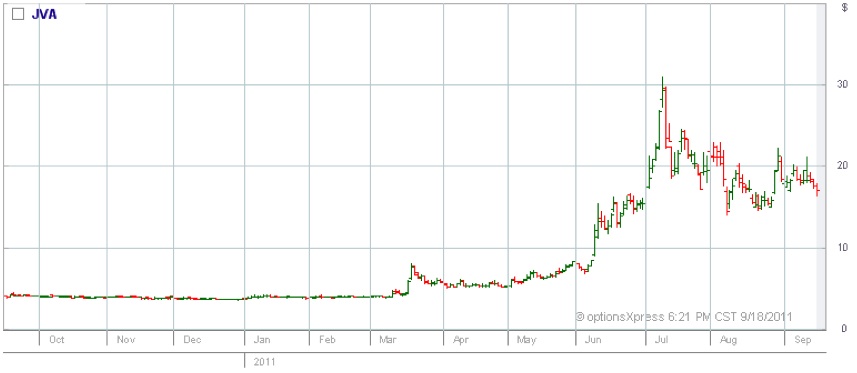
However, we strongly believe that JVA’s shares are overpriced (P/E: 31x) and its business risks are High…Not a good Brew! Below are our Top reasons to avoid these shares:

 |
| Coffee Futures (KCU11) |
The Income Statements below are for FY’09, FY’10 and 2Q’11. They include adjustments (i.e, hedging profits are taken out of reported numbers). FY’09 adjusted numbers also exclude a non-recurring gain of $2.1mm. This results in 36% and 73% lower EPS for FY’10 and FY’09, respectively. 2Q’11 adjustments resulted in 69% lower EPS. Under the “% Change” column, is noted how the adjustments affect the Balance Sheet and Cash Flow Statements.


In bad times (i.e, when management makes “wrong-way” bets) reported earnings could decrease significantly (as in the most recent quarter, see below).


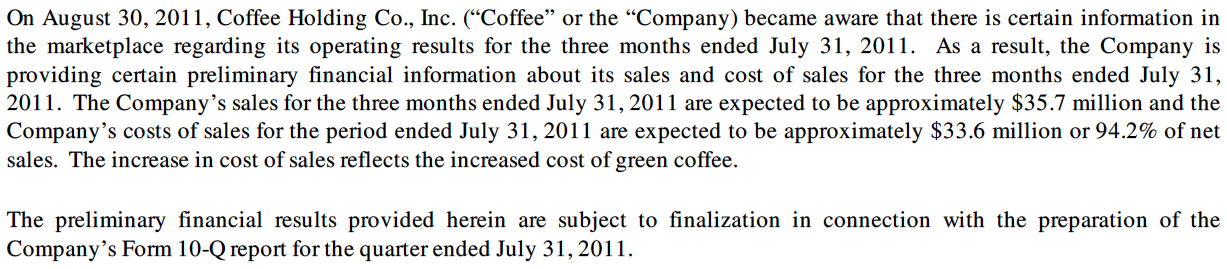 |
| Source: Coffee Holding Co, 8K, Aug. 30, 2011 |
C) JVA director Daniel Dwyer, is a coffee trader at Rothfos Corporation- a coffee bean supplier. Mr. Dwyer is also responsible for a large account between the two companies. Refer to Item 13 of Form 10-K/A for FY’10 for more information.
Conclusion:
We have not seen evidence JVA is using aggressive accounting or misusing its relationships. We also believe the company is correctly accounting for its hedging program as per IAS 39. However, they’re just too many risks (e.g., dependence on GMCR) to justify its high share price
Disclosure: The author has no investment position in JVA (short or long). The author does not receive any monetary or implicit dollar benefit from this article.
SodaStream is not your grandfather’s Green Mtn. Coffee Roasters – it’s better than that! How then….?
Key Difference # 1
Harking back a decade ago, GMCR was showing real earnings – more recent earnings are suspect. It reported steady revenues and earnings growth, of which was organic (i.e., internal, without acquisitions). Now, I’m not quite sure what their earnings really are, or how rapidly the company is really growing given the huge acquisitions skewing reported growth. For additional information, please refer to this website’s article on Green Mountain, which essentially alludes to the company’s deceptive practices of presenting earnings.

The tables below present GMCR’s proforma condensed income statements for FY 1Q’11 and 2Q’11 (including YTD). The Securities and Exchange Commission’s Rule 210.11-02 requires that when making an acquisition that the acquiring company disclose what its condensed income statement would look like if the acquisition occurred at the beginning of a reporting period. This helps investors distinguish between internal and external growth.
 |
| GMCR 1Q’11 Proforma earnings |
 |
| GMCR 2Q’11 Proforma earnings, including year-to-date data. |
Key Difference #2
SodaStream’s internal, or organic growth, is better than GMCR’s. Other than an acquisition of assets from a bankrupt company in the Nordic region that got hit with the financial crises, all of SodaStream’s growth is internal. For example, during FY 1Q’11, both operating income and adjusted EBITDA doubled while revenues grew 50% (all without acquisitions!).
 |
| Note: company uses the Euro as a reporting currency. Source: SodaStream |
Key Difference #3
SodaStream’s financial statements are significantly more transparent compared to GMCR. In order for analysts to accurately measure and forecast the company’s performance several key metrics are necessary including:
In this regard, SodaStream is excellent. The company not only provides data points in its conference calls, but significant data about its business model is disclosed in its government filings. This allows some comfort when analyzing trends, as SodaStream analysts have to reconcile two different businesses:
 |
| Note: Soda Makers and Consumables data sourced from SodaStream |
In the above table, note that CO2 cylinders are also included under Soda Makers (first line) as the company typically includes one or two CO2 cylinders in its “Starter Kit” Soda-makers. The Consumables line includes both the CO2 cylinders as well as Flavored Syrups, of which the company discloses in separate text. Unit sales are also disclosed on a quarterly basis (not in the above table).
Key Difference #4
Market share, revenue and earnings potential are all greater for SodaStream than Green Mountain Coffee Roasters. With an $11Bn market cap and nearly $2.5Bn in expected revenue for FY’11, the company is quickly reaching its asset-size capacity. GMCR is expecting 82%-87% reported revenue growth for FY’11. We are not saying that the potential is not there for GMCR, but with a U.S. market share of 35%-45% for household coffee makers (depending on whom you ask, or trust..) it will be difficult to continue rapidly gaining share. At some point, GMCR will effectively become the market, and it’s growth will be limited by the LT growth of the home consumer coffee market. This growth is likely to be 5%, according to Moody’s.
It is difficult to ascertain the addressable market for GMCR, but it is likely below $9Bn (U.S. At-Home market). This author has seen global numbers for single-serve coffee that were no higher than $4Bn. However, NPD Group notes that GMCR has only 8-9% of the total number of U.S. coffee drinking households. However, this percentage needs to be distinguished from the addressable market which we view as far smaller (see $ amounts above).
For comparison, SodaStream’s beverage market is slow-growing (see chart below) but the total market size is absolutely huge. According to Datamonitor, the global off-premise soft drink and sparkling water market generated $216Bn and $34Bn respectively in 2009.

Note that SodaStream is a global company with products selling in 41 countries. Given that SodaStream’s soda makers are unique products that some consumers will never buy, and given market control by Coca Cola, etc., market share potential (in % terms) is likely limited to 5%-15%. So far, SodaStream’s highest penetration has been in Sweden where its share is 21%.
Taking a conservative share percentage of 6% yields an addressable market size of $15Bn (includes soda + sparkling water). This compares with SODA’s FY’10 revenues of just $227.8MM (converted from Euros). In global market share terms, this equates to just 1.5% of the addressable marekt. It is difficult to ascertain SODA’s U.S. market share, it’s most important market. However, management believes it is negligible (~ 0.25% of the total market). Hence, the potential for SodaStream is huge, so long as the company executes well.
Disclosure: the author is long GMCR, SODA