Introduction: Interface Inc. (NASDAQ: IFSIA) is an environmentally responsible manufacturer and marketer of interior floorings. This Atlanta, GA based company specializes in modular carpets. Modular carpets are essentially the square carpet tiles one often observes on the floors of open offices. The photo below highlights the company’s fancier squares marketed to the more fickle consumer market.
Interface Inc. is what this website labels a Socially Responsible Investment. The various sections below examine different parts of the company and factors affecting its valuation (stock price). This research report examines the company from all perspectives, not just whether it fits our ESG criteria. We have gone to great lengths to examine the company as objectively as possible.
 |
| Stock Chart courtesy of Google Finance. |
Disclosure: the author is long shares of IFSIA.
|
Executive Summary
|
|
What we really like…
|
And not so much..
|
|
· Attentive, focused management
|
· Shares near 52week high
|
|
· Brand leader, high market share
|
· Moderate financial leverage
|
|
· Strong orders/business trends
|
· High volatility of stock (Beta)
|
|
· High peak-earnings power
|
· High earnings volatility
|
|
· Leadership in Sustainability
|
· Low business diversity
|
|
· Conservative accounting
|
· Sensitive to the business cycle
|
|
· Successful restructuring
|
· Moderate Insider Selling
|
We believe Interface, Inc. is a good SRI investment candidate. Our rating is “7” (out of a possible 10). This rating incorporates quantitative and qualitative factors, including the corporate, social and responsibility efforts of the firm. The Executive Summary above summarizes key investment factors/risks. With the goal of maintaining objectivity, every investment is required to have a full list of Negatives, or if you will, “things we don’t like very much.”
Firstly, this is a company with a soul, best exemplified by its chairman and founder, Ray Anderson. In 1994, he set his company the aim of having zero impact (“Mission Zero”) on the environment by 2020. As Ray describes, it was a dramatic wake up call, analogous to “a spear in his chest.” He challenged his employees “to head the first company that, by its deeds, shows the entire industrialized world what sustainability is in all dimensions: people, process, product, place and profits – and in doing so, become restorative through the power of influence.” And the company hasn’t looked back since!
After a long day trail-running in Bend, Oregon, it was a pleasure to run into Ray Anderson’s book at the local library. Readers are encouraged to literally check it out!
This “Mission Zero” has enabled the company to be ever focused on its customers, end markets and products. In fact, the company now specializes only in modular carpet. This enabled Interface to become a leading niche player in flooring, though to the risks of low business diversity and high sensitivity to the Business Cycle.
One big byproduct of Mission Zero has been a transformed culture, one that has inspired creative solutions, making carpeting as exciting as iPads. Key share data and our rating are below:
|
Share Data:
|
|
|
|
Interface, Inc.
|
IFSIA-Nasdaq
|
|
|
Price (1/03/11)
|
$16.20
|
Our Rating:
|
|
52-Wk Range:
|
$17.15 – $7.05
|
7
Out of 10. Higher is better.
|
|
YTD % Change
|
88%
|
|
Market Cap (mm)
|
$1,020mm
|
|
Shares Outstanding
|
63mm
|
|
Beta:
|
1.6x (Bloomberg)
|
|
Dividend (Yield %) qtr.
|
$0.02 (0.5%)
|
|
Price/Book value:
|
3.8x
|
|
|
Earnings estimate:
|
$0.60 (12/2010)
|
This report is provided for information purposes only and is not a recommendation.
|
|
P/E ratio (on above est)
|
27x
|
Share Data on Interface Inc. (see table) reveals a company with moderately-priced shares as measured by their Price/Book value (3.8x), Price to Earnings (P/E) ratio, and the fact that its share price is closer to its $17.15/share 52-week high, than to its low. Dividend Yield (of <1%) and high Beta imply volatility of the shares. Market Capitalization of $1Bn categorize this as a Small-Cap investment, further increasing return, as well as risk. Our overall investment rating is 7, reflecting strong business order trends, but higher-than-average balance-sheet and share price volatility.
Given the company’s higher overall volatility, we expect its share price to be highly sensitive to the business cycle. The best time to purchase shares of such industrials are during the bottom of business cycles (e.g., 2009) when companies are reporting net losses. Based on economic forecasts, it appears economies (especially the U.S. are in the beginning to mid-stage of recovery). Hence, upside “remains in the cards.”
|
Income Statement (’09)
|
Balance Sheet
|
Cash Flow statement
|
|
Revenues: $858.9mm
|
Current Assets: $388.0
|
Cash Operating: $55.5
|
|
Oper Inc.: 64.7
|
Total Assets: 727.2
|
Cash Investing: (-7.4)
|
|
EBITDA: 89.9
|
Total Liabilities: 481.1
|
Cash Financing: (-3.5)
|
|
Net income: 10.9
|
Total Sh.Equity: 246.2
|
Free Cash Flow: 43.6
|
Revenues for FY Dec’09 were $858.9mm, down from the $1.1Bn peak reached in both FY’08 and FY’07. Given strong order growth, analysts say revenues could reach their previous peak by FY’11. We believe Interface can easily meet this estimate given its excellent execution. As such, the most vital factor will be whether or not a secular transition to modular carpets continues overseas, particularly Germany (a large market), where carpet tile penetration remains under 10%. (Refer to the Industry Discussion for additional information.)
Interface has large operating leverage as well as moderate to high financial leverage. This combination can yield exciting earnings gains when business trends improve. Thus, a 1% Revenue gain will likely lead to far higher changes in net income.
Shareholders’ Equity of $246.2mm is somewhat low, given the company’s moderate (mostly long-term) debt profile needed to support fixed assets/machinery. Shareholders’ Equity has declined over the last 1½ years given net losses and a restructuring.
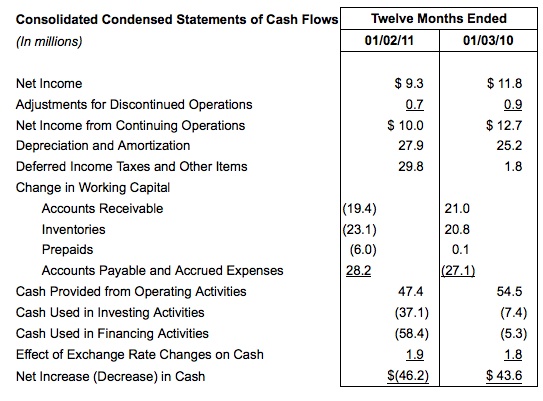
Surprisingly, Interface managed to remain Free Cash Flow positive over the last 3years, though this was attributed to the inclusion of non-cash items.
In the charts below (sourced by Bloomberg LLC), rather than focusing on the absolute dollar level over the years, note the volatility of them. This volatility can be seen in nearly all aspects of the company ranging from earnings, cash flows, assets and share price. Such volatility visually demonstrates that this company is riskier than average. From left to right number 1) is Revenue, 2) Operating Income, 3) Pretax income, 4) Income bef XO items, 5) Net income, 6) Basic EPS before abnormal items.
|
Profitability
|
E: estimate
|
|
Gross Margin (%)
|
35.1% (2010E)
|
|
EBITDA Margin
|
12.5% (2010E)
|
|
Operating Margin
|
9.8% (2010E)
|
|
Return on Assets
|
5.3% (2010E)
|
|
Return on Capital
|
6.0% (2009)
|
|
Net Profit Margin
|
2.6% (2009)
|
Gross margins have been fairly good, rising from 33% in FY’09 to 35% by 2010E. We expect this to continue into 2011, as the company moves up-market into the consumer market. However, it is not certain how net income will be affected, as the consumer market requires more advertising spending. Overall, net profit margins are likely to surge given the company’s high operating leverage. Interface’s Return on Capital is also expected to rise given the above comment, as well as lower interest costs related to its recent bond refinancing.
|
Recent Financial Performance:
|
3Q’10 highlights, and trends
|
|
Revenues
|
$253MM (+16% Y/Y)
|
|
SG&A
|
61.4MM (24% of sales)
|
|
Operating Income
|
$28MM (11% of sales)
|
|
Net Income
|
$12MM (5% of sales)
|
Recent Financial Performance: In the table above, we summarized Interface’s 3Q’10 financial performance. Please see link for
Press Release. Rather than reiterate the company’s statements, we highlight key data points, comments and provide our opinions below.
- Overall performance was quite good (rising GPM, OpM and NPM compared to previous quarter and year-ago).
- Profitability and margins accelerated. However, we expect limited SG&A improvements. In fact, management stated SG&A might not go lower than 23% going forward.
- Revenue growth rate accelerated (+16% Y/Y)
- Order growth was very good (+20% Y/Y)
- Company is gaining market share
- Geographic strength in Emerging Markets (China, India, Brazil)
- The upscale consumer business; Bentley Prince Street, is slowly returning to profitability (but not yet…)
- Management indicated that 4Q’10 is tracking well.
The most important factor in the 3Q’10 report, in our opinion, was the strength in Emerging Markets. This strength is vital as the company is about to open a new plant in China, and needs the demand. This plant likely won’t be profitable until sometime later in FY’11, given start-up costs and low initial capacity utilization (15%-20%). We also note that the Chinese authorities have made significant efforts over recent months to cool their economy and associated inflation.
|
Liquidity / Credit Stats:
|
E: estimate
|
|
Credit Ratings (Moody’s / S&P)
|
B1/B+ (senior secured ratings)
|
|
Bank lines:
|
New $300MM Revolver on 11/9/10
|
|
Cash & Near Cash items:
|
$115.4MM (FY’09) $81MM (Sept’10)
|
|
Capex
|
$28MM E (FY’10)
|
|
*Significant Debt maturities:
|
$100MM (FY’12) $150MM(FY’13)
|
|
Free Cash Flow:
|
$50MM E (FY’10)
|
*company is refinancing its public bonds
Overall liquidity is quite good, supported by a new revolving credit facility, positive Free Cash Flow and longer debt maturities. During Nov’10, Interface announced it would refinance its two bonds with a new $275MM senior notes due 2018. At a 520bp spread (estimated) the notes would yield approximately 7.6%. This compares with a weighted average coupon of 10.6% on the retiring bonds (aggregating to $260MM). Both Moody’s and S&P affirmed Interface’s credit ratings in their review of the company’s new notes.
|
Leverage
|
FY’09 ended 12/09
|
|
Operating Leverage
|
3 (very high)
|
|
TD/ Common Equity
|
124% (moderate)
|
|
TD / Total Capital
|
54.5% (moderate)
|
|
TD /EBITDA trailing 12 mos.
|
3.3x (moderate)
|
|
Net Debt / EBITDA
|
2.0x (low to moderate)
|
|
Total Debt / Market Capital
|
56% (moderate)
|
|
Cash flow Operations / TD
|
18% (low to moderate)
|
As implied from the table above, Total Leverage (operating leverage + financial leverage) is high. Using 3Q’10 data to calculate Operating Leverage, for every 10% increase in revenues, Interface’s EBIT rises 30%. Total Debt is somewhat high too, especially relative to Common (Shareholders’) Equity, which in itself has been volatile over the last 10-year period. (Refer to the chart below.) However, other measurements such as Net Debt/EBITDA indicate a company with lower financial leverage.
 |
| Source: Bloomberg LLC |
|
Valuation:
|
Forward data based on estimates
|
|
P/E ratio:
|
33x (TTM FY’10) 27x forward P/E
|
|
Price /Book
|
3.8x (as of 3Q’10 ended Sept.)
|
|
Price / Sales
|
1.1x (TTM FY’10)
|
|
EV / TTM EBITDA
|
10.5x (TTM FY’10)
|
|
Dividend Discount Model (DDM) calculated price:
|
$4.20 (Source: Bloomberg LLP)
|
|
Actual Share Price
|
$16.20 (as of 1/03/11)
|
|
DDM price vs. actual share price
|
(-74%) thus shares are Overvalued
|
Notes: EV: Enterprise Value, TTM: trailing 12 months.
Interface is moderately priced using most measures. In one extreme, Price-to-Sales is low, indicating undervalued shares. On the other extreme, the Dividend Discount Model (DDM) is indicating very overvalued shares. The model utilized is a 3-stage DDM consisting of a growth, transition, and mature stage. The Beta applied was 1.56x (source: Bloomberg) which we confirm given Interface’s high share and balance sheet volatility. (In fact, the Beta provided by Google Finance is even higher, at 2.5x.) The long-term growth rate used was 14.7%, which declines to 8.7% at the Maturity stage. Both growth rates are higher than we are comfortable utilizing.
As a check on the DDM, we calculated an intrinsic share price value based on the Free Cash Flow (FCF) model. Under the above FCF model, the equity valuation of the firm was $10/share, using a 1.56x Beta, but more conservative growth rates, including 3% terminal growth rate.
|
ESG Profile
|
|
|
|
CsrHub ratings:
|
Rating
|
AGR Rating
|
|
Overall rating
|
47
|
CONSERVATIVE
|
|
Community rating:
|
46
|
AGR Score
|
|
Employees rating:
|
50
|
93rd Percentile
|
|
Environment rating
|
44
|
|
Governance rating
|
45
|
Equity Risk Factor: 5 (best)
|
|
Source: CSRhub.com
|
Highest rating is 100
|
Source: Audit Integrity
|
As mentioned in our introduction to Interface Inc., the company is a global leader in sustainability. This would be the “E” in ESG. While not a recognized leader in overall ESG, I believe the company may be better than what’s implied by its CsrHub rating (left column). CsrHub rates Interface an overall 47 rating. This is slightly below the average rating for a US company as well as its industry peers. They do, however, give Interface a 50 rating for its relationship with employees, which is higher than the overall company average of 48.
This website will use CsrHub and Audit Integrity ratings given that they are a good standardizing and benchmarking tool. However, we also recognize the high weighting of qualitative criteria in Socially Responsible Investing.
CSR Hub is a website used to aid people such as SRI investors and socially conscious consumers make decisions on whom to do business with. CsrHub’s overall ratings are based on four categories that are in the table above. Their major data sources are ASSEAT4 (from Thomson Reuters) Governance Metrics International, IW Financial, Trucost, Vigeo, and several others.
Interface has received numerous awards over the years, including advancing to 16th place in CRO Magazine’s 100 Best Corporate Citizens. This is a prestigious ranking often cited by the media. Though, we note the company hasn’t placed in CRO Mag’s more recent lists. Interface was also recognized by Time Inc. 2007 edition of Heroes of the Environment magazine special. More recently, Interface was honored by the Centers for Companies That Care.
Another aspect of SRI due diligence is analyzing the company’s quality of financial reports and accounting. This website will rely on Audit Integrity to benchmark companies in this area. Interface, Inc. earns high ratings in this category, rated in the 93rd percentile of all companies examined by Audit Integrity. This means the company’s financial statements and governance have not been flagged by Audit Integrity. Flagged companies tend to have a higher probability of earnings restatements, and litigation. AGR, did note though, that executive/board Insider Selling was a concern.
Further, Interface’s AGR score has remained high (usually above-average) over the last 3 years (See chart below). The company also earns an Equity Risk Factor of “5”, its best rating. Companies with such a rating have outperformed the market.
Industry & Macroeconomic Data:
|
Industry / factors:
|
Broad End-market
|
End Markets
|
|
Carpet/Flooring
|
Commercial
|
Corporate Office
|
|
Growth: 3% CAGR
|
Consumer
|
Consumer/Home
|
|
Size: $2.3Bn U.S. (2009)
|
Institutional
|
Government
|
|
Secular Trend towards Modular carpeting
|
|
Healthcare
|
|
Mature industry
|
|
Hospitality
|
|
|
|
Retail
|
|
|
|
|
Interface participates in the carpeting segment of the Flooring industry. The Flooring industry is in the Maturity stage of its life cycle. This stage is marked by low growth, high penetration, high competition and revenue cyclicality. Despite competition with fairly large companies (e.g., Mohawk Industries: $5.4Bn in revenues FY’09) Interface continues to compete successfully using a niche strategy focusing on innovating the modular carpet market. During the last 10 years, it has shifted its business from 40% modular to 92%.
Most readers are probably familiar with modular carpet. It’s basically the square carpet tiles seen in offices. In modern day offices, they offer some key advantages, allowing technology workers to simply add/remove floor cables without having to cut into the whole floor. Modular tiles also have no need for padding, offer quick installation, and produce less waste. And what waste there is left over, can easily be recycled thanks to Interface’s lead in sustainability.
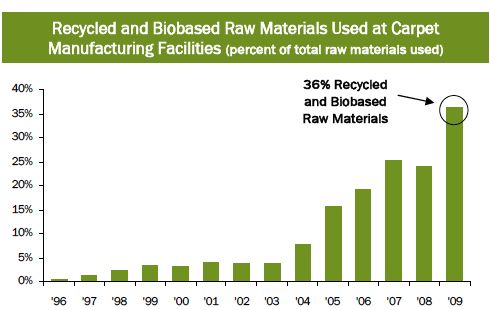
The total U.S. Commercial Carpet market was $2.3Bn in 2009 and is forecast to grow 3% annually to $3.3Bn by 2020 (Sources: Interface, Invista, Floor Focus, Carpet & Rug Institute, Catalina Research). Penetration of modular carpet was 38%, up from 26% in 2004, and the company hopes this could reach as high as 65% by 2020.
In the United Kingdom (not part of the above research data) the penetration rate is as high as 44%, hence this implies some room for US penetration increases. The largest opportunity lies in Germany where the market size is large and the penetration rate is just 8%.
Of course, carpet growth is influenced by construction activity, and anyone following the Financial Crises is well aware that construction is at recessionary levels. The table below forecast that both non-residential (e.g., offices) and residential construction won’t take off until 2012. However, we note new construction is only one part of the equation, as office remodelings are another demand factor. Interface estimates that remodeling is as high as 90% in the U.S., but far lower 10% in Emerging Markets. Of course, most of the buildings in Emerging Markets are relatively new, so there’s a lower need for remodeling.
|
Forecast for end markets
|
2010e
|
2011e
|
2012e
|
2013e
|
|
Real GDP (United States)
|
2.6%
|
2.4%
|
3.3%
|
3.2%
|
|
|
|
|
|
|
|
Real Nonresidential Construction
|
(14.8%)
|
(4.9%)
|
4.4%
|
14.7%
|
|
|
|
|
|
|
|
Residential Construction
|
(3.7%)
|
8.4%
|
32.4%
|
15.8
|
|
|
|
|
|
|
|
Source: S&P Economic Research, Baseline forecast.
|
While the majority of revenues have historically been to the Office Market, Interface is expanding its customer base into the Retail, Government, Healthcare and Education Segments. It’s also moving into the Consumer market via its upscale FLOR brand. Interface opened its first retail store in Chicago in 2009. This is a big risk and return opportunity for the company.
Peer Analysis:
As stated earlier, the module carpet industry is a segment of the larger Carpet industry, which includes conventional broadloom carpet. However, several carpet companies are part of larger, home furnishing companies.
Interface’s largest direct competitors are highlighted in yellow shading below. Interface also competes directly with Shaw Industries (not in table below) especially for modular carpeting. Shaw, which is also Georgia based, was acquired by Warren Buffet’s Berkshire Hathaway in 2000. Shaw is the world’s largest carpet company with estimated revenues of $5Bn and over 30,000 employees.
As the reader can see from the above tables, Interface, is smaller than the largest publicly-traded home furnishings/carpeting companies. Interface’s revenues approximate nearly $1Bn; however this compares with the industry median of $2.8Bn. Though, revenues and EBITDA are expected to grow much faster relative to the industry, which has been suffering a slow turn-around. (All numbers, including estimates were provided by Bloomberg LLC.) This faster growth results in a higher than peer group P/E ratio of 25x. (Note: P/E based on stock price data as of 11/2010).
The P/E column is repeated in the second table for Valuation comps with its peers. Interface’s shares are clearly trading at above its peer group. We have also provided the WACC, showing just how high weighted average cost of capital is not only for Interface, but the industry as a whole. Privately-held Shaw Industries, in comparison has the luxury of being under the Berkshire Hathaway umbrella; and the firm likely has a far lower cost of funding compared to most of its peers.
In conclusion, we truly believe Interface will continue to do well in business and Mission Zero, as the company continues to grow more innovative, smarter, and maybe even a bit kinder!
DISCLOSURE: The author is long IFSIA, Interface, Inc. The above research is not a recommendation to purchase the securities of Interface, Inc.